An AWS CloudWatch alarm that enters the ALARM state does nothing on its own. It publishes a notification, and the path from that notification to a person who acknowledges it is where most on-call failures happen. Teams often tune thresholds for weeks while the alarm lands in a shared inbox or a subscription nobody watches. This guide covers the full path: how alarm states map to paging decisions, how to connect CloudWatch to Acked, how to size evaluation periods and missing-data handling so the pager fires only on sustained faults, and how to verify the chain before go-live.
Quick Takeaways
Key Insight | Explanation |
|---|---|
Page on the transition into ALARM only | Route OK transitions as recovery events and treat INSUFFICIENT_DATA as a separate decision, not as a page for the same chain. |
Period length and datapoints set the detection delay | A 60-second period with 1 of 1 datapoints pages on a single breaching minute. Use M out of N values sized to the service's tolerance. |
Missing data is a per-alarm decision | Set breaching, notBreaching, or ignore explicitly for each alarm. Leaving the default on sparse custom metrics produces false pages or silent gaps. |
Check which statistic your pipeline keeps | Some monitoring layers retain only the average of CloudWatch latency metrics, which hides tail spikes that a percentile or maximum would show. |
Set the first escalation wait above the alarm window | If the first wait is shorter than the evaluation window, a second responder is paged for a fault CloudWatch was about to clear. |
Force a state change before go-live | Use aws cloudwatch set-alarm-state on a test alarm, then confirm the page, escalation, acknowledgement, and recovery all appear in one response history. |
How CloudWatch Alarms Reach a Pager
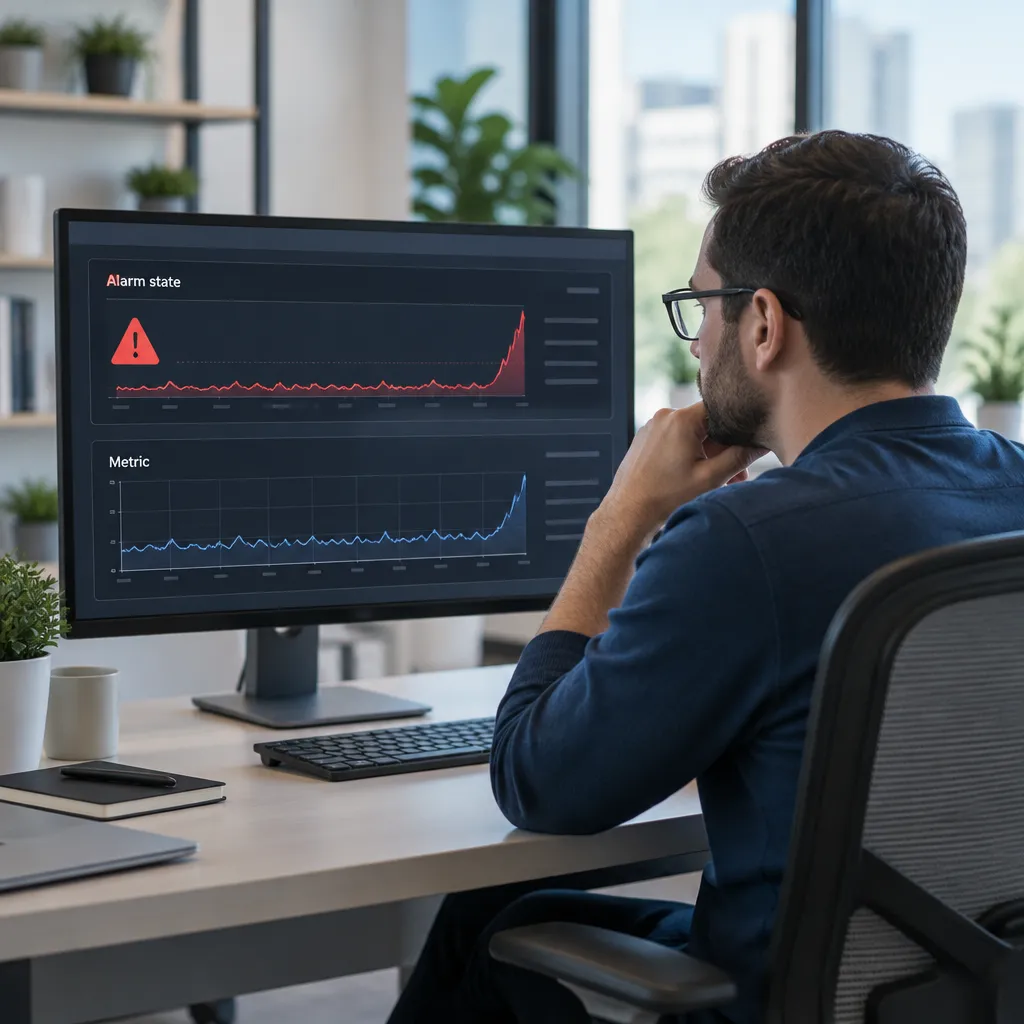
A CloudWatch alarm evaluates a metric or a metric math expression against a threshold and moves between three states: OK, ALARM, and INSUFFICIENT_DATA. Each transition can invoke actions. In a paging setup, those actions publish to an Amazon SNS topic, and that topic delivers to the ingest endpoint of your Acked connection. The alarm's state machine, not the metric itself, determines what reaches a responder.
Alarm states and what each should trigger
Page on the transition into ALARM, and only for conditions that a human must act on within your acknowledgement window. INSUFFICIENT_DATA means CloudWatch does not have enough datapoints to decide. That usually points to a stopped agent, a broken publisher, or a metric that stopped emitting after a deploy. Treating it as an incident is occasionally correct, but routing it into the same escalation chain as a live fault floods the rotation.
Route the transition back to OK as a recovery event. Recovery must close the open alert in Acked so the response history shows a complete lifecycle. Configure an OK action on every alarm that has an ALARM action, or stale open alerts accumulate and someone has to close them by hand.
The SNS hop and where deliveries fail
SNS sits between the alarm and the pager, and its failure modes are easy to miss because nothing surfaces in the alarm console. An HTTPS subscription must be confirmed before it delivers anything, and a subscription in a pending state looks healthy from the alarm side. Check subscription status and topic delivery metrics after every endpoint change.
Avoid one shared topic for every service. A shared topic pushes all routing logic into alarm names or message fields that the receiving side must parse. Separate topics per owning team keep ownership in your infrastructure definition, where it is reviewed alongside the alarms themselves.
Connecting CloudWatch to Acked
Create the Acked connection before attaching it to production alarms, so the first page can be confirmed with a single test alarm. Acked distinguishes direct sources, which target one service, from vendor connections, which route payload attributes across services and fall back to a default service when no rule matches. Once more than one team's alarms land in the same AWS account, a vendor connection is the better fit. The same pattern is used in the Datadog on-call alerting integration, so teams running both sources can keep one routing model.
Create the connection and a fallback service
Open the integrations area, create the connection for your alarm source, and select a fallback service before adding any rules. Unmatched alarms go to the fallback, so a fallback that points at an unowned or inactive service becomes a silent failure. Copy the ingest URL and treat it as a credential, since anyone holding it can inject alerts into your rotation. The monitoring integrations overview lists the current source options.
Routing alarms to the right service
Routing works on payload attributes, so decide which attribute carries ownership before writing rules. Alarm name prefixes are fragile, because teams rename alarms during refactors and the rule quietly stops matching. Alarm tags are more durable, but the standard alarm notification body does not include them, so tag-based routing requires an enrichment step that reads tags and adds ownership to the payload.
A simpler design writes the owning service name into the alarm description or another field you control, then matches on that value. It is less elegant than tag-driven routing, but it is deterministic and easy to audit with a single query against your alarm definitions.
Pro tip: Send one test alarm through the fallback path first. If it lands on the fallback service rather than the owning team, either the rule order or the attribute name is wrong, and you have found the problem before a real incident does.
Alarm Thresholds That Avoid Noisy Pages
Most noisy paging comes from alarms that evaluate a single sample. Period length, evaluation periods, and datapoints to alarm together define how long a breach must persist before the state changes. A configuration of 1 datapoint out of 1 on a 60-second period pages on any single minute of elevated latency, which is rarely what the owning team wants.
Evaluation periods and datapoints to alarm
Use the M out of N form for metrics with bursty behavior. Three breaching datapoints out of five on a 60-second period require three breaching minutes inside a five-minute window before ALARM fires. Set those values from the response time the service owner has committed to, not from the defaults the console suggests.
The trade-off is detection delay. Longer windows reduce false pages but extend the time before a hard outage pages, since a metric that drops to zero still needs the full window to breach. Split hard-failure conditions, such as a health check error count above zero, into a fast alarm with a short window. Keep slow-degradation alarms, such as sustained p95 latency, on the wider window.
Choosing the statistic
The statistic defines what the threshold means. Average latency can look acceptable while a meaningful fraction of requests exceeds the timeout budget. Confirm what your monitoring layer ingests as well as what CloudWatch computes. Datadog's documentation notes that AWS publishes average, minimum, and maximum latency, but when pulling metrics from CloudWatch, Datadog receives only the average. Any alert evaluated downstream on that average will miss the tail spikes a percentile or maximum alarm would catch.
An alarm is only as reliable as the statistic it evaluates. Verify the statistic at the point where the page is decided, not at the point where the dashboard reads it.
Missing Data and Recovery Handling
Missing data handling is the setting most teams leave at its default and then discover during an incident. The four options are missing, notBreaching, breaching, and ignore. Each one determines whether silence counts as a breach, and the correct choice depends on what silence means for that specific metric.
Treating missing data per alarm
Use breaching for metrics where absence indicates failure, such as a heartbeat-style custom metric published by a worker process. Use notBreaching for metrics that legitimately stop publishing, such as queue depth on a service that receives no overnight traffic. Use ignore when the alarm should hold its current state through irregular publishing, which prevents flapping on sparse metrics.
A common mistake is applying breaching to a sparse custom metric. Every publisher restart then produces an ALARM, and the rotation learns to ignore the page. Test the setting by stopping the publisher in a non-production account and observing the resulting state change before you rely on it.
Closing alerts on recovery
Recovery depends on the OK action firing and reaching the same connection that raised the alarm. A recovery that arrives as a new alert rather than closing the open one indicates a deduplication mismatch, and the result is duplicate open pages. Acked matches recovery transitions to the open alert using the deduplication key from the source, so the OK notification must carry the same alarm identity as the ALARM notification. Verify this in the test run, not during the first real recovery.
Escalation Policy for CloudWatch Alerts
Escalation levels, waits, and repeat limits determine how many people an unacknowledged CloudWatch alarm reaches before the chain stops. Derive these settings from the alarm's evaluation window and the owning team's acknowledgement target. Choosing them arbitrarily produces either premature second pages or alerts that go unanswered for too long. For the broader design of levels and rotations, the on-call software guide covers the parts that matter.
Sizing the first wait
Set the first-level wait longer than the time a self-resolving spike needs to clear. If the first wait is shorter than the alarm's evaluation window, a second responder is paged for a condition CloudWatch was about to resolve. For an alarm evaluated as 3 of 5 on a 60-second period, a first wait of 10 minutes is a reasonable starting point for a team with a 15-minute acknowledgement target. Adjust it once the response history shows how often alarms clear before the wait expires.
Handling an exhausted chain
When every level and repeat is spent, Acked marks the alert unreachable and leaves it open for handling. That state needs an owner. Route it to a named escalation path, such as the engineering manager on duty, or the alert will sit open with nobody assigned. Review unreachable alerts as a daily operational item until the chain has been proven under real conditions.
Pro tip: Pair every CloudWatch-backed service with a documented escalation owner. An exhausted chain with no named owner is one of the most common reasons an unreachable alert stays open for hours.
Comparing Ways to Route CloudWatch Alarms
Three approaches cover most CloudWatch paging setups. They differ in where ownership is decided, how much context reaches the responder, and what the system knows after delivery. The table compares them on the criteria that matter once an alarm fires at night.
Approach | Strengths | Limitations |
|---|---|---|
Direct SNS subscriptions to email or SMS | No extra infrastructure, and the fastest option to configure | No acknowledgement, escalation, or response history, so an unread message cannot be distinguished from a delivered one |
Custom relay (Lambda or API) that enriches and forwards | Full control over payload content, tag lookups, and routing logic | The team owns retries, deduplication, and the on-call state machine, which is usually underestimated |
Dedicated on-call platform connected through a vendor connection | Routing rules, rotations, escalation, and recovery recorded in one history, while alarms stay in CloudWatch | Adds a dependency, and per-service routing must be kept in sync with rotation changes |
Where a custom relay fits
A practitioner thread on improving CloudWatch alerts describes a common pattern: an API receives CloudWatch notifications, adds context such as runbook links or recent deploy information, and forwards the result to chat or another destination. That pattern works well for enrichment. It becomes a liability when the same relay also has to record who acknowledged the alert and whether it is still open, because that requires a state store and a timer system.
Where direct subscriptions stop
Direct subscriptions are adequate for informational alarms, such as a budget threshold that needs to reach a finance mailbox. They are inadequate for anything that requires a response, because nothing in the chain knows whether a person acted. If an alarm pages, the transport must record acknowledgement, not only delivery.
Operating Checks After Go-Live
Go-live is when many CloudWatch paging setups face their first real test. A short, scripted verification run before that point finds the failures that matter most: wrong routing, missing recovery, and escalation that never reaches the second level. Each check should be repeated after any change to alarm definitions, SNS subscriptions, or rotations.
Testing the full path with a forced alarm
Force a state change on a test alarm with aws cloudwatch set-alarm-state, passing --state-value ALARM and a --state-reason string. Confirm that the page reaches the owning service, that escalation advances when you do not acknowledge, and that setting the state back to OK closes the alert. CloudWatch re-evaluates the alarm at its next period, so run the sequence promptly to keep the forced state in effect while you observe it.
Test each channel your team relies on. Push notifications on iOS and Android, email, and outbound webhooks are available on every plan. Team and Business plans add voice paging with separately billed usage. Acked does not provide SMS paging, so if your rotation depends on text messages, plan for that gap before go-live rather than during an incident. Current plan details are in the Acked documentation.
Reviewing the response history
After the test, read the response history from start to finish. Check the delivery attempts, the acknowledgement timestamp, the escalation level reached, and the resolution time. A chain that pages correctly but records no acknowledgement usually points to a device or push configuration problem rather than a routing fault. Keep these records for each service, since they are the evidence you need when a postmortem asks why a page arrived late. The guidance on alerting without adopting a platform explains how to keep existing monitoring in place while this record is built.
Frequently Asked Questions
Should every CloudWatch alarm page an on-call engineer?
No. Page only alarms that describe a condition requiring action within the acknowledgement window. Route informational alarms, such as budget thresholds, to email or a chat channel, and reserve the escalation chain for service-impacting faults.
Why does my CloudWatch alarm page on a single datapoint?
The alarm is most likely configured with one evaluation period and one datapoint to alarm. Increase the evaluation periods and set datapoints to alarm to an M out of N value so that a single breaching sample does not change the state.
What should missing data be set to for a low-traffic metric?
Use notBreaching for metrics that legitimately stop publishing when traffic stops. Use breaching only when silence indicates a failed publisher, and confirm the behavior by stopping the publisher in a non-production account.
Can CloudWatch alarms be routed by tag?
The standard alarm notification does not include alarm tags, so tag-based routing needs an enrichment step, such as a Lambda function that reads the tags and adds ownership to the payload. Matching on a field you control in the alarm description is simpler and easier to audit.
Does an unacknowledged alert keep escalating after the chain ends?
No. When every escalation level and repeat is spent, the alert is marked unreachable and stays open for handling. Assign a named owner for that state so it does not sit unattended.
Which CloudWatch alarm has generated the most pages in your rotation, and did the fix belong in the threshold, the statistic, or the routing?
Make on-call alerting simpler with Acked
Acked connects your existing monitoring tools to on-call schedules, notifications, and escalation policies. Get critical alerts to the right people without replacing your monitoring stack.
Get started with Acked — Free to start, with simple flat-rate pricing and no per-seat fees.